You think you know your code. You work with it every day, you know where the critical parts are, you know where it hurts. Right?
I built PhpCodeArcheology because I thought the same about my own code - and then discovered that gut feeling and reality diverge more often than you’d expect. Since then, I use the tool daily. For two things: assessing and refactoring legacy projects. And keeping new development in check from day one.
Legacy projects: where are the bodies buried?
When I take over or assess a legacy project, I first get a rough overview of the code. Directory structure, namespaces, general architecture, the usual. Then I install PhpCodeArcheology and let it run:
composer require --dev php-code-archeology/php-code-archeology
./vendor/bin/phpcodearcheology
My first stop is always the Health Score. A number from 0 to 100 that tells me where things stand. Not a final verdict, but a starting point.
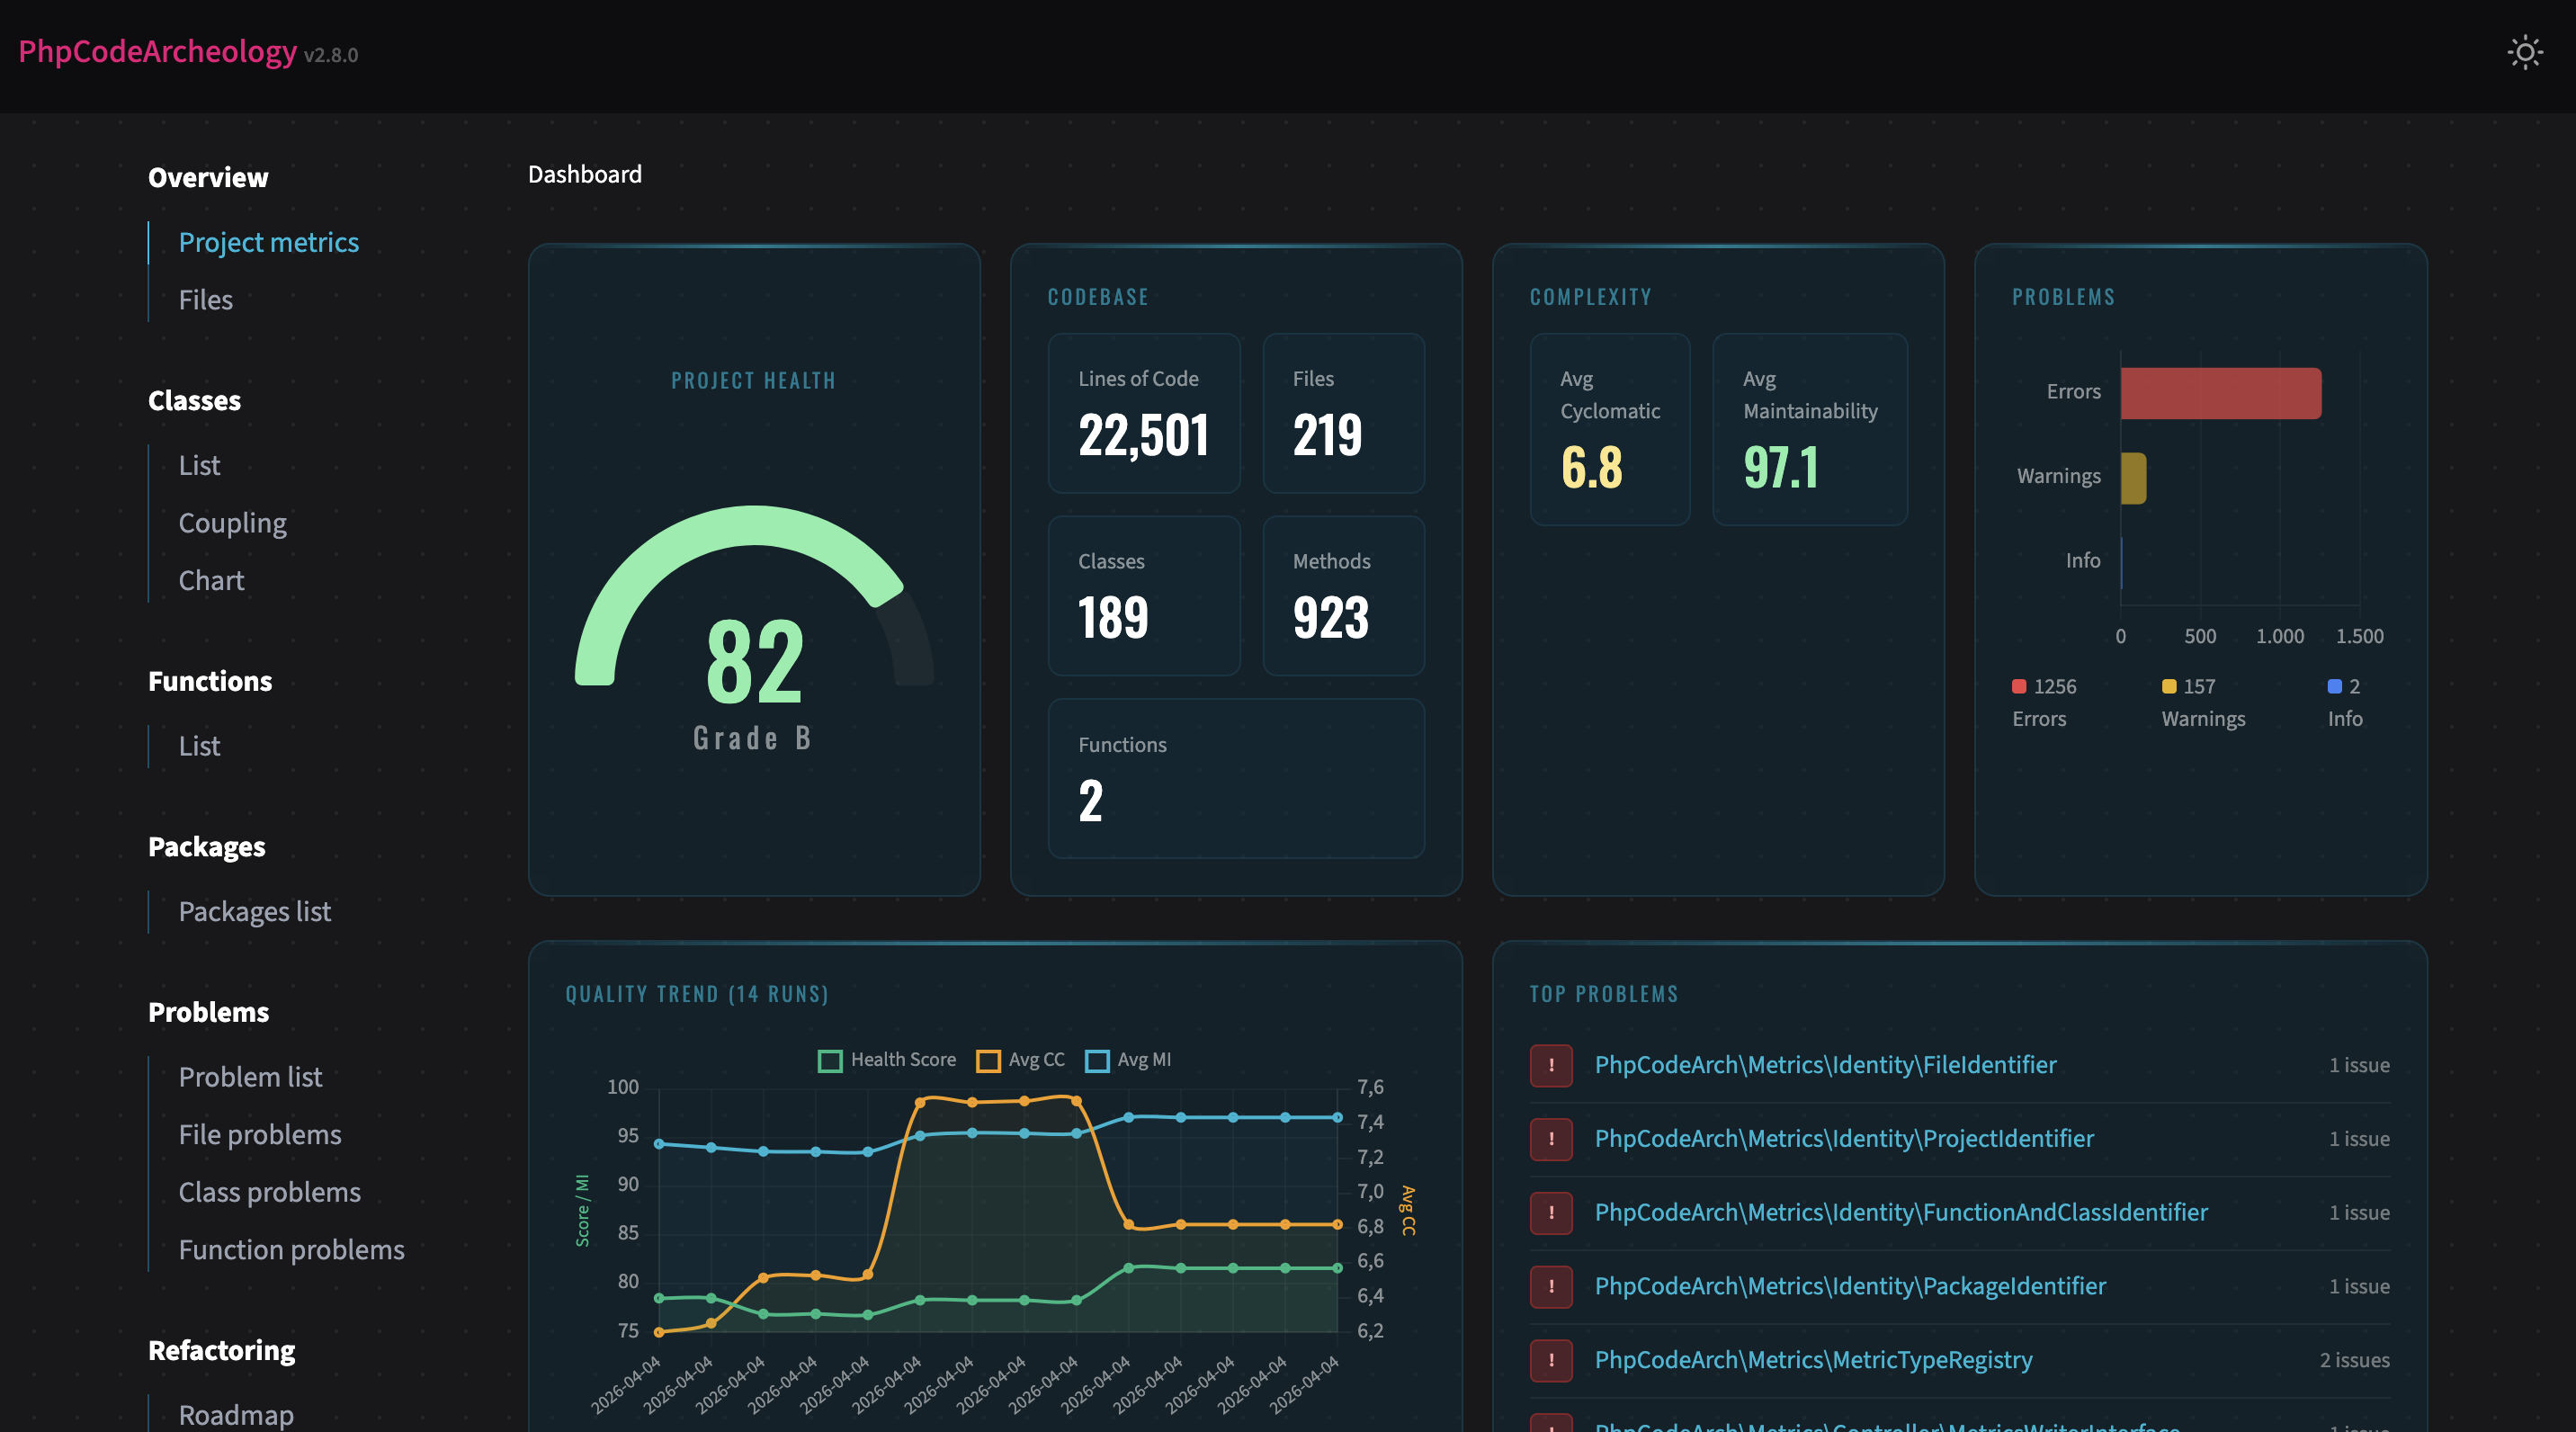
From there, I dig into the problems. Three things I look at first: God Classes, Coupling, and Complexity. The classics. And usually the ones with the biggest leverage.
But the really interesting moment comes when I open the Git analysis and the Knowledge Graph.
The blind spot
On a project I took over, we had discussed beforehand where we expected the most problems. Everyone had their guess, everyone knew “that one spot” in the code.
The analysis surfaced a completely different class. One that, according to the git history, was modified extremely often while also having very high complexity - a textbook hotspot. The original developers had grown so accustomed to it that nobody even mentioned it as a problem anymore.
That’s exactly my point: without measurement, you rely on gut feeling. And gut feeling has blind spots.
Prioritising refactoring
PhpCodeArcheology has hotspot detection. I call it the refactoring hit list internally. It shows you files with high change frequency and high complexity. These are the spots that deserve the most attention because they’re touched often and hard to understand at the same time.
In the case above, we started with exactly that hotspot. Not because it was the most obvious one, but because the data clearly said: this is where the biggest leverage is.
Measuring success
After every refactoring, I run the tool again. Not just at the end, but after individual steps, to see right away whether it helped. For that I use either the normal trend view or the compare command:
./vendor/bin/phpcodearcheology compare baseline.jsonShort feedback loops matter. You don’t want to refactor for three weeks and then find out the metrics haven’t moved.
When refactoring makes the numbers worse
It happens. And that’s fine.
When you split up a God Class, the number of classes goes up. New dependencies emerge, coupling can increase in the short term. That doesn’t mean the refactoring was wrong. You need to read the numbers in context.
And sometimes you just have to accept: what this code does is complex. The complexity lives in the use case, not in bad design. You can’t pull the complexity out of the code no matter how many times you refactor.
PhpCodeArcheology is a tool, not a judge. The goal isn’t to turn everything green at all costs. The goal is to understand.
New development: measure from day one
The second use case isn’t about archeology - it’s about prevention. I enable PhpCodeArcheology in every new project from day one.
Sure, you can always check out old git states and analyse retroactively. But I prefer a solid history from the start. If you measure for the first time after six months of development, you’re missing the trend. You see a snapshot, not a trajectory.
The workflow
Whenever a feature is done, I run the tool. Sometimes in between with --quick for a fast terminal overview:
./vendor/bin/phpcodearcheology --quick src/Regularly then the full HTML report. For deeper analysis I also use the MCP server - a separate article on that is coming.
Dependency circles in teams
During team development on a new project, PhpCodeArcheology uncovered a dependency circle that we wouldn’t have found nearly as quickly otherwise. When multiple developers work on different features in parallel, circular dependencies can easily creep in. And they only become a real problem when you don’t catch them early.
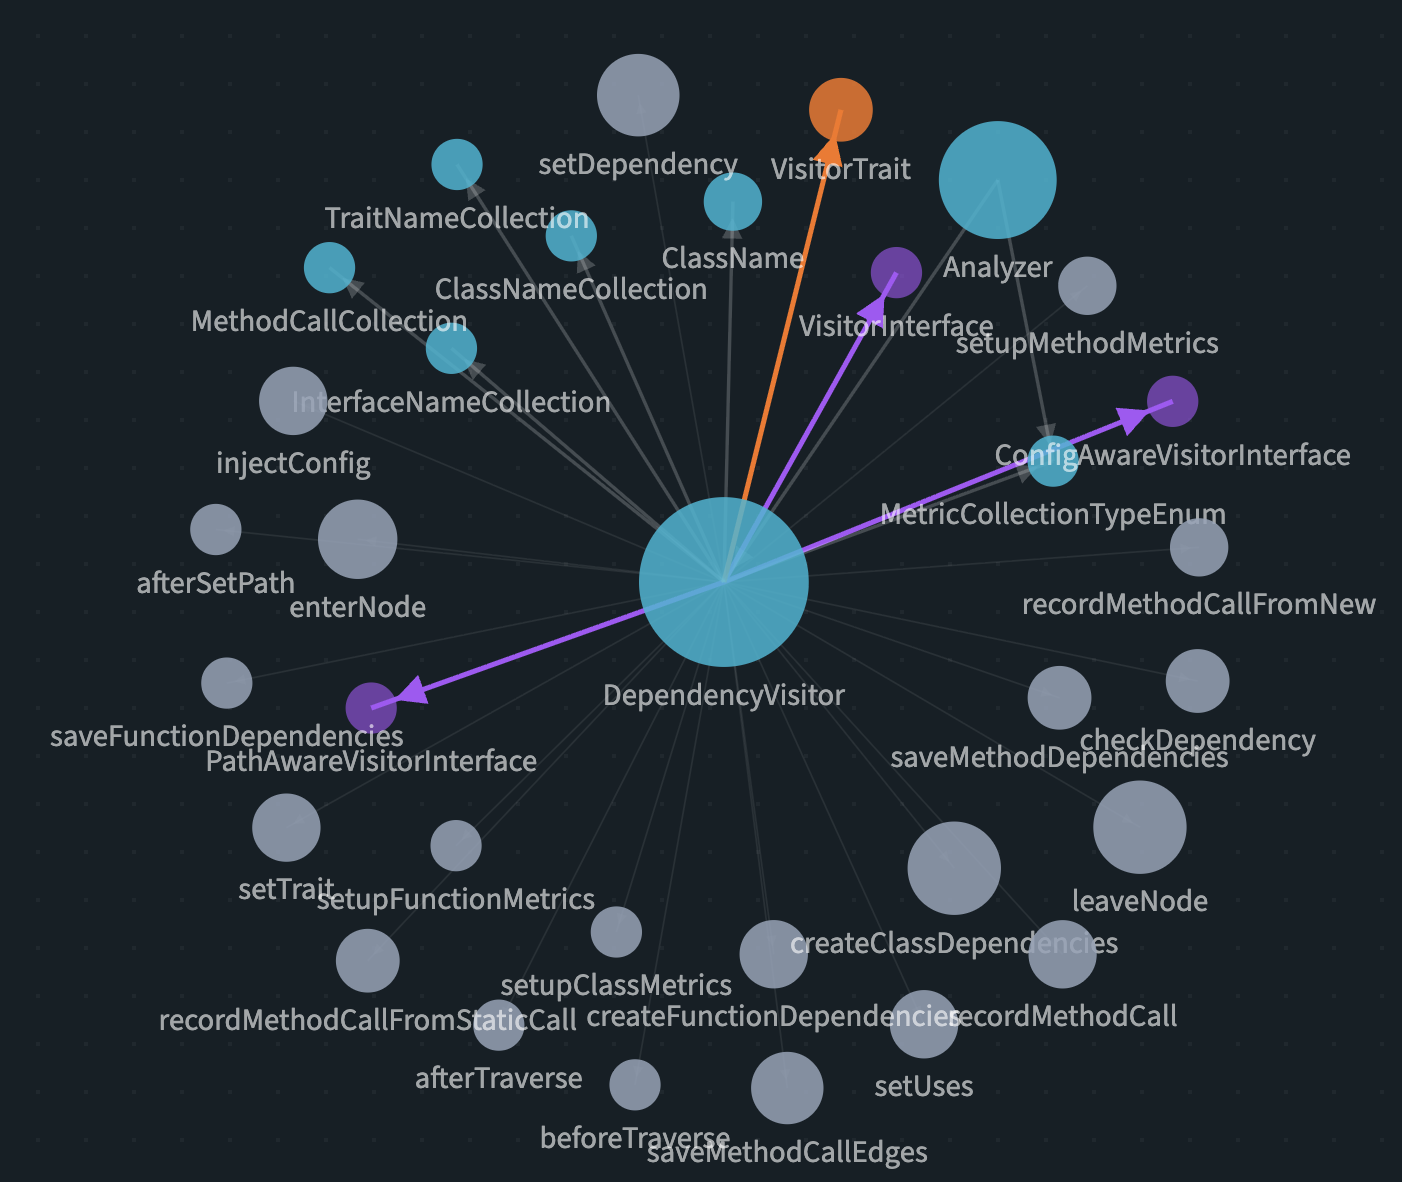
The Knowledge Graph makes these structures visible. Which class has how many connections? Where are the central nodes? Are there cycles? You can see it at a glance.
What I’ve learned about my own code
Since I’ve been using the tool regularly, one thing has become clear: the planning phase could stand to be a bit longer. :)
Seriously though: when you measure from the start, you see how architectural decisions play out. Not in theory, but in numbers. And that changes how you plan.
Metrics that surprised me
Cyclomatic Complexity: You need to be careful with this one. A high CC isn’t automatically a problem. Sometimes the code is complex because the use case is complex. Sometimes it’s unnecessary complexity. Experience has to make that call.
LCOM (Lack of Cohesion of Methods): I underestimated this one initially. It took me a while to get behind the metric. But now I wouldn’t want to miss it. LCOM tells you whether a class truly forms a unit or actually carries multiple responsibilities. When the value is high, you often have a class that should be split - and that holds true in practice almost every time.
Conclusion
I don’t use PhpCodeArcheology because I built it. I built it because I needed it.
Whether it’s legacy assessment or new development: the tool gives me the overview I wouldn’t have without measurement. It replaces neither experience nor judgement - but it gives both a solid foundation.
You can know your code. But you can also measure it. And when gut feeling and data disagree, the measurement is usually right.
PhpCodeArcheology is open source and free. Check out the GitHub repo - feedback is welcome.